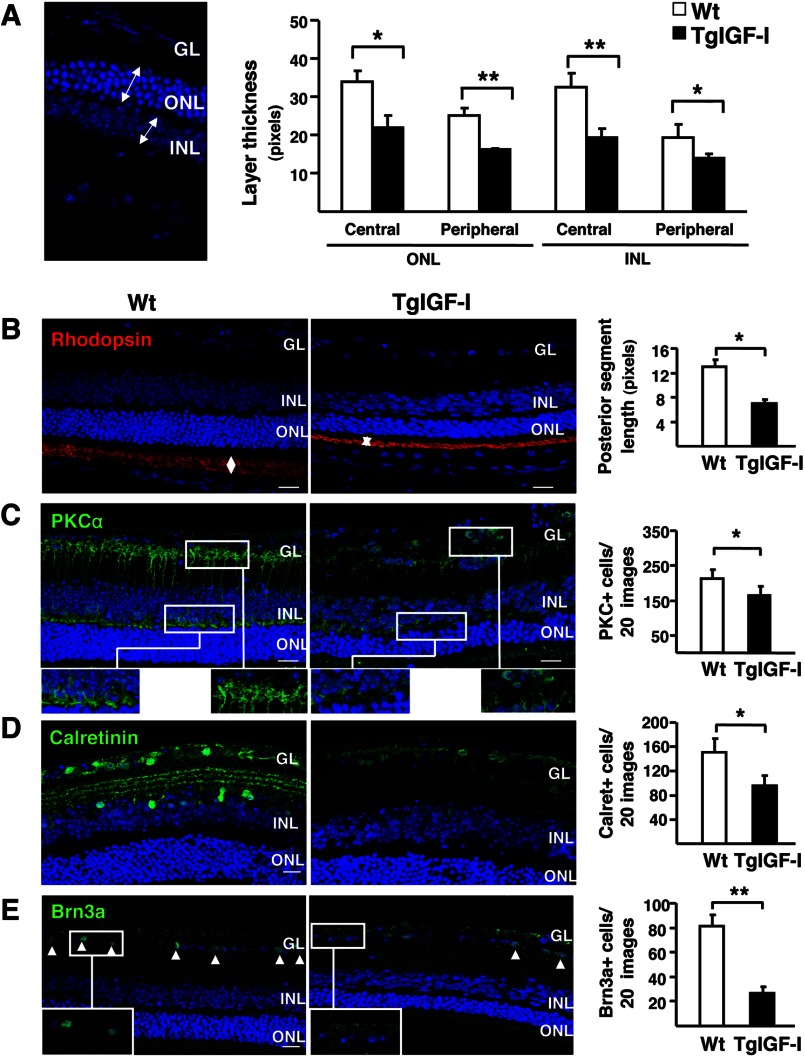
FIGURE 2.
Reduced thickness of the different retinal layers and decreased neuronal populations in IGF-I-overexpressing retinas. A, thickness of retinal layers was measured at 7.5 months of age. Retinal layers were clearly thinner in TgIGF-I mice, with statistically significant reductions in both ONL and INL thickness in central and peripheral retina. B–E, representative images of the immunolabeling of retinal sections with specific neuronal markers (left) and quantification of labeled populations (right) in 7.5-month-old WT and TgIGF-I mice. B, rhodopsin immunolabeling (red) showing positive staining in the outer segment (OS) of photoreceptors. Outer segment length (arrows) was measured in medial retinal sections. The length of the outer segment was significantly reduced in transgenic retinas. C, representative images of PKCα immunostaining (green). The terminals of bipolar cells located in the outer and inner plexiform layers (upper and lower insets) were strongly positive in WT retinas. Cell bodies spanning from the INL to the GL were also labeled. Transgenic retinas showed reduced PKCα reactivity. Quantification of the number INL PKC-positive cells revealed a significant loss of bipolar PKC+ cells in transgenic mice. D, representative images of calretinin immunolabeling (green) showing reduced staining in both the GL and the INL in TgIGF-I. Quantification of the number of calretinin+ cells demonstrated a reduction in the number of amacrine neurons in transgenic retinas. E, immunofluorescent detection of Brn3a (green), expressed specifically in the nuclei of ganglion neurons (arrowheads). Transgenic retinas showed fewer Brn3a positive nuclei in the GL. Nuclei were counterstained with DAPI (blue). Values are expressed as the mean ± S.E. of 5–9 animals/group. *, p <0.05; **, p <0.01. Scale bar, (A) 35.51 μm; B–E, 18.37 μm.

