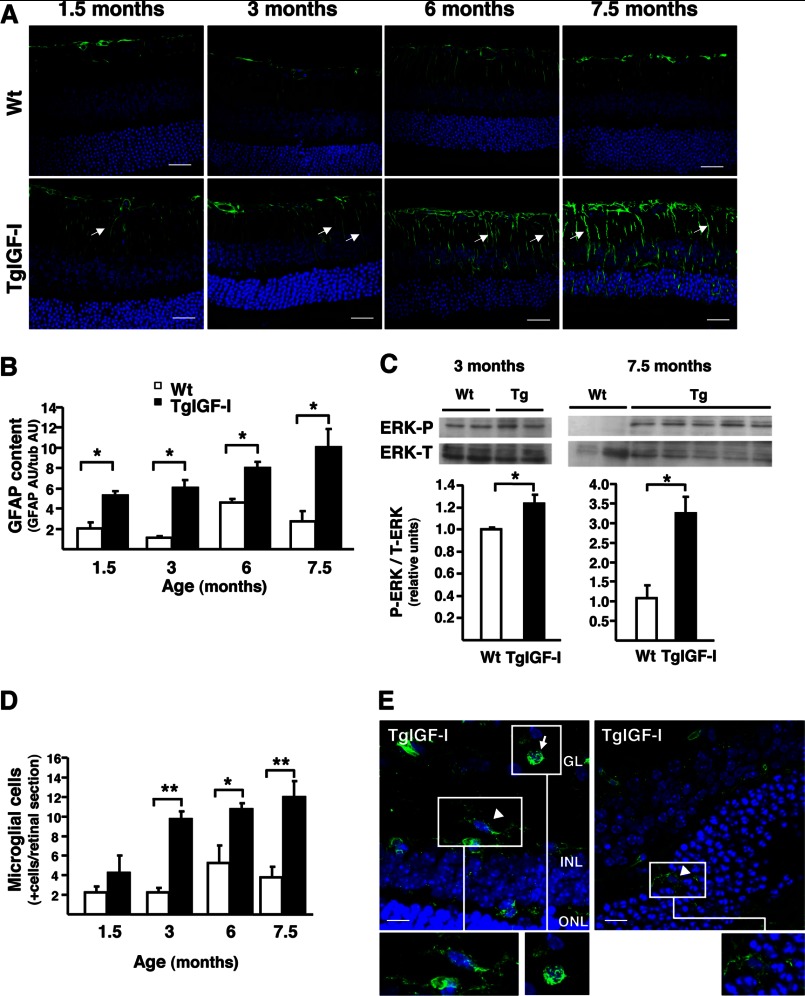
FIGURE 5.
Progression of gliosis and microgliosis in TgIGF-I retinas. A, GFAP immunofluorescent detection (green) in retinal sections from WT and TgIGF-I mice at different ages. At all ages analyzed, transgenic retinas showed overexpression of GFAP, especially in radial Müller cells processes spanning the entire retina (arrows), where GFAP is hardly expressed. This pattern of GFAP staining indicated the presence of reactive gliosis in transgenic retinas. Nuclei were stained with DAPI (blue). Scale bar, 31.27 μm. B, GFAP content was analyzed by Western blot in retinal extracts from WT and TgIGF-I mice at the indicated ages. Quantification of blots demonstrated that GFAP levels were increased in transgenic retinas at all ages. AU, arbitrary units. Values are expressed as mean ± S.E. of two animals/group. *, p <0.05. C, ERK phosphorylation was analyzed by Western blot in retinal extracts from WT and TgIGF-I mice at 3 and 7.5 months of age. After normalization by total ERK levels, quantification of blots showed that P-ERK levels were increased in transgenic retinas at both ages. Values are expressed as mean ± S.E. of four animals/group. *, p <0.05. D, immunofluorescent detection with tomato lectin (Lycopersicum esculentum) allowed the identification of microglial cells in retinal sections. The number of lectin-positive cells per section was determined in retinal sections from WT and transgenic retinas at different ages, showing statistically significant differences in retinas of mice aged 3 months and older. Values are expressed as mean ± S.E. of four animals/group. *, p <0.05; **, p <0.01. E, representative images obtained from transgenic retinas at 7.5 months of age. Arrow indicates a round-shaped lectin+ cell, likely an activated microglial cell, and arrowheads indicate a microglial cell with characteristic stellar shape and dendriform ramifications. Scale bar, 12.06 μm (left panel), 8.54 (right panel).

