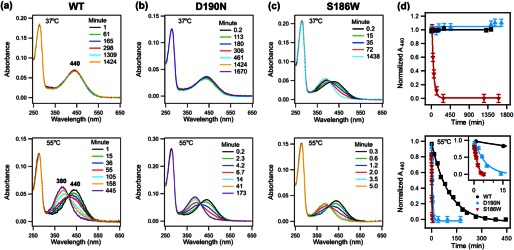
FIGURE 9.

Hydrolysis of Schiff base in rhodopsin, acid denaturation assay for WT rhodopsin, D190N, and S186W mutants. a, WT; b, D190N, and c, S186W rhodopsin at 37 °C (top) and 55 °C (bottom). Over time, A440 decreases, and A380 increases, indicating hydrolysis of the SB. d, normalized A440 plotted as a function of time. The fitted curve is added to guide the visualization of the decay trend.
