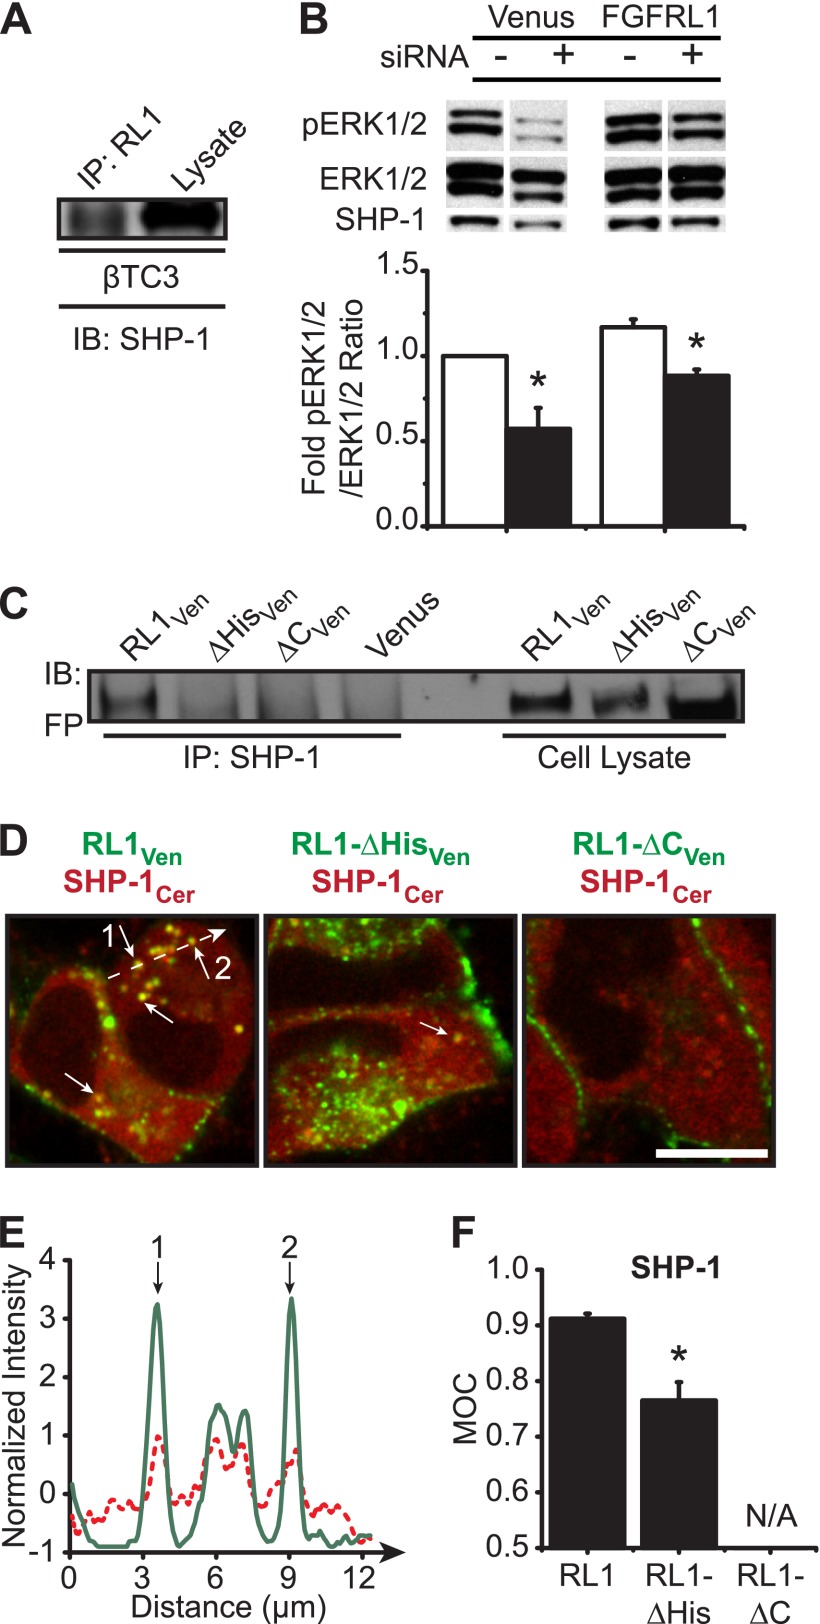
FIGURE 5.
SHP-1 associates with the C-terminal domain of intracellular FGFRL1. A, endogenous SHP-1 identified by Western immunoblotting (IB) (right lane) co-immunoprecipitated (IP) with endogenous FGFRL1 in βTC3 cell lysates (left lane; representative blot shown). B, phosphorylation of ERK1/2 was significantly decreased in both Venus control and FGFRL1-overexpressing cells when SHP-1 protein levels were reduced by SHP-1 siRNA expression (+ siRNA) compared with scrambled siRNA expression (− siRNA). Representative blots are shown; pERK1/2 membranes were stripped and reprobed for ERK1/2 (to assess sample loading and determine pERK1/2:ERK1/2 intensity ratios) and SHP-1 (to assess impact of siRNA expression). Data are plotted as the mean fold-change in phospho-ERK1/2 response ± S.E. compared with Venus control for three separate experiments. *, p < 0.05 by two-sample t test compared with scrambled siRNA control. C, lysates from βTC3 cells expressing FGFRL1Ven, -ΔHisVen, -ΔCVen, and control Venus were immunoprecipitated (left lanes) with anti-SHP-1 and immunodetected using an anti-fluorescent protein antibody (Living Colors). Comparison with nonimmunoprecipitated cell lysates (right lanes) confirmed association of the full-length FGFRL1Ven construct with endogenous SHP-1. D, dual-color confocal imaging further confirmed co-localization (yellow; arrows) of full-length FGFRL1Ven protein (RL1Ven; green) with SHP-1Cer (red) in βTC3 cells (D, left panel). The long dashed arrow represents regions of interest examined in the line profile (E). Receptor/SHP-1 co-localization was reduced or below detection levels when the histidine-rich region (RL1-ΔHisVen) or the C terminus (RL1-ΔCVen) was deleted, respectively (D, middle and right panels). Scale bar, 10 μm. E, representative line profile showing normalized intensities of SHP-1Cer (red) and FGFRL1Ven (green) along an arbitrary line in D. The numerals 1 and 2 indicate overlapping peaks that correspond to punctate regions observed to have strong co-localization in D. F, MOC was calculated for distinct punctate regions from each sample and plotted as mean MOC ± S.E. (with the exception of RL1-ΔC/SHP-1 samples where co-expression was not observed; N/A, not applicable). *, p < 0.05 compared with Venus, RL1-ΔC, and RL1-ΔHis controls using one-way ANOVA. n = 4.

