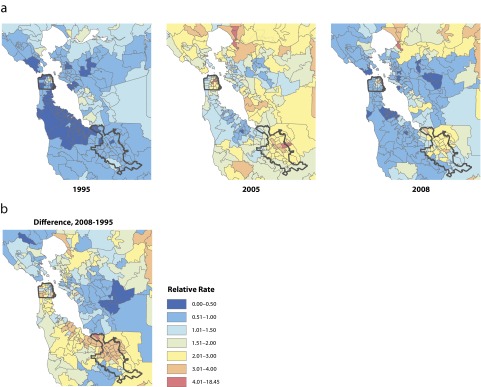
FIGURE 4—

Posterior estimated growth of relative incidence rates of methamphetamine abuse and dependence, (a) geographic distribution for selected years and (b) geographic distribution of overall change: San Francisco Bay Area, 1995–2008.
Note. Bay area maps show pattern of positive spatial autocorrelation.
