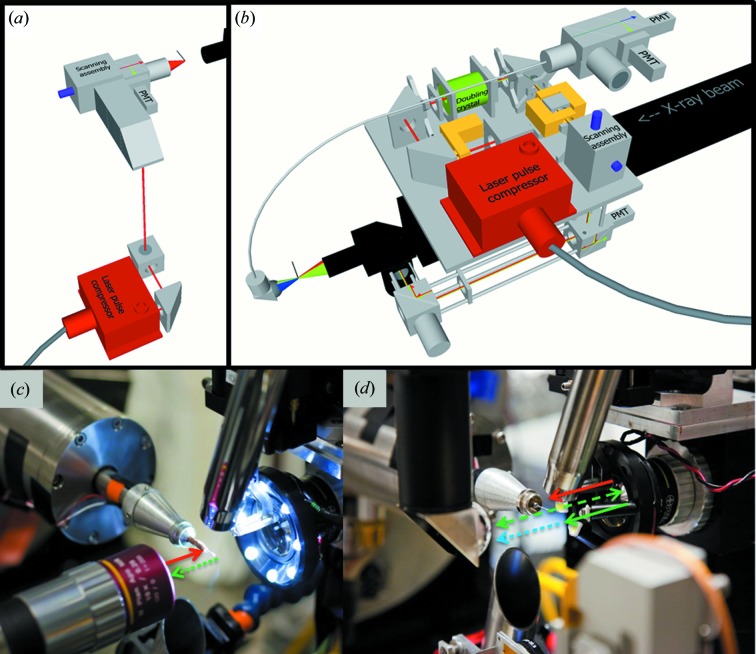
Figure 1.
(a) Schematic of the downstream NLO microscope; (b) schematic of the upstream NLO microscope; (c) close-up view of the downstream NLO microscope, with the solid arrow representing incident laser propagation (red, 1060 nm) and dashed arrows representing the frequency-doubled signal (green, SHG at 530 nm); (d) close-up view of the upstream NLO microscope, with solid arrows representing incident laser propagation (red, 1060 nm; green, 530 nm) and dashed arrows representing the measured signal (green, SHG at 530 nm; blue, TPE-UVF).

