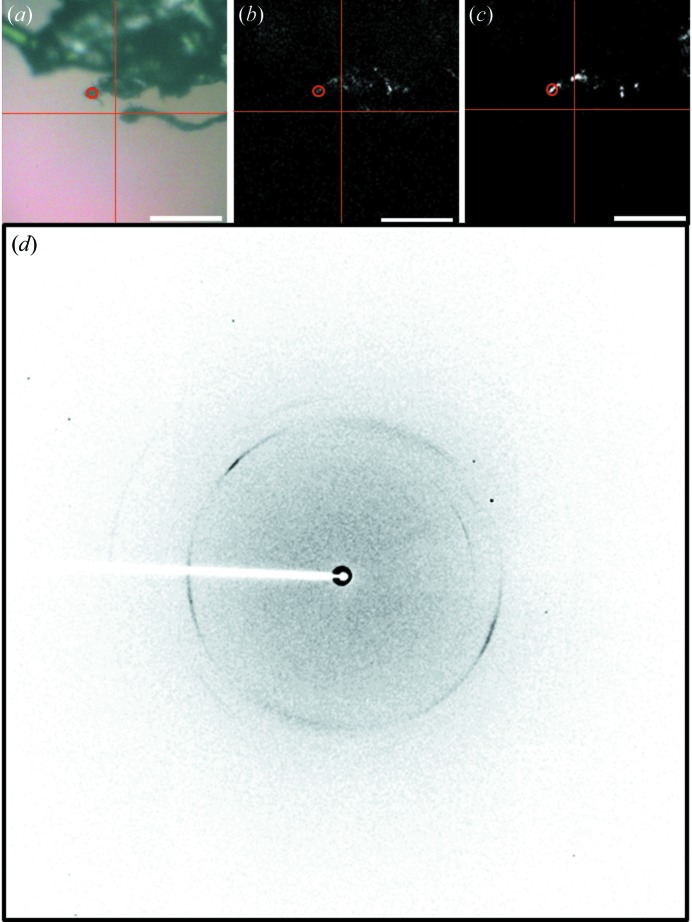
Figure 5.
(a) Bright-field image of α-cellulose fibers and the corresponding (b) epi-SHG and (c) trans-SHG images, all 300 × 300 µm. (d) X-ray diffraction of a 10 µm-diameter area within the red circle of each image. X-ray energy: 12.0 keV; exposure time: 1 s; photon flux: 2.7 × 10¹⁰ photons s−1 (unattenuated beam); sample-to-detector distance: 300 mm; maximum theoretical resolution: 2.25 Å. Scale bars are 100 µm. Cross-hairs were added to (b) and (c) to assist in orienting the fields of view with respect to the bright-field image.

