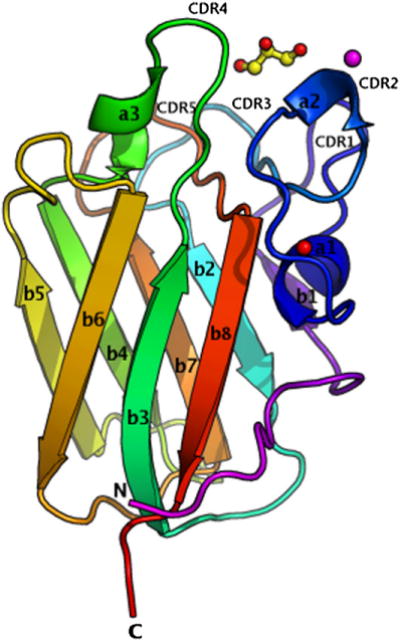
Figure 1. Structure of LLYlec.

(See also Figure S1, which shows how LLYlec is oriented with respect to the rest of the toxin molecule.) The structure is represented in colors, from the N terminus in magenta to the C terminus in red. Glycerol is shown as ball and stick, the calcium ion is shown as a red sphere, and the Ni ion is shown as a magenta sphere. Secondary structural elements and CDR loops are labeled as described in the text. This and all following structural figures were drawn with PyMol (Delano, 2002).
