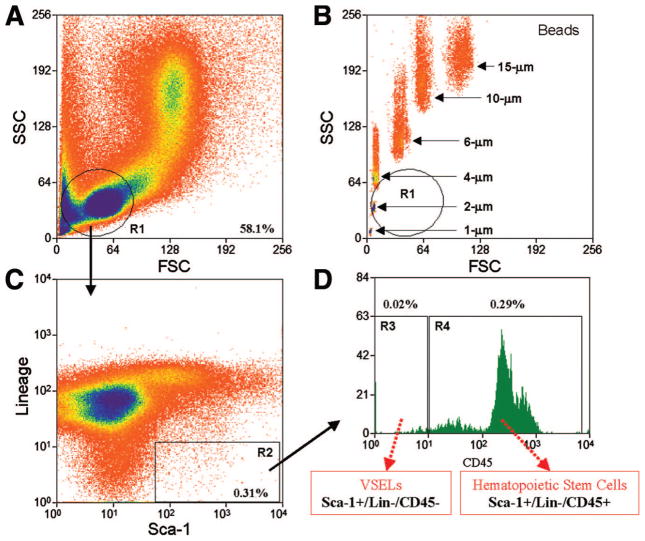
Figure 1.
Flow cytometric isolation of bone marrow-derived Sca-1+/Lin−/CD45+ hematopoietic stem cells and Sca-1+/Lin−/CD45− VSELs. Representative dot plots show sorting of small cells from the lymphoid gate (A) based on expression of Sca-1 (fluorescein isothiocyanate) and lineage markers (phycoerythrin) (C) and CD45 (APC-Cy7). (D): R3 contains Sca-1+/lin−/CD45− VSELs, whereas R4 contains Sca-1+/lin−/CD45+ cells. By comparing the sorting of bone marrow cells (BMCs) with the sorting of beads with known diameter, the FSC axis in (B) confirms the very small size (2–10 μm) of the cells in the region of interest in (A). As shown here (R3), only 0.02% of total BMCs are VSELs. Abbreviations: FSC, forward scatter characteristics; R, region; SSC, side scatter characteristics; VSEL, very small embryonic-like stem cell.

