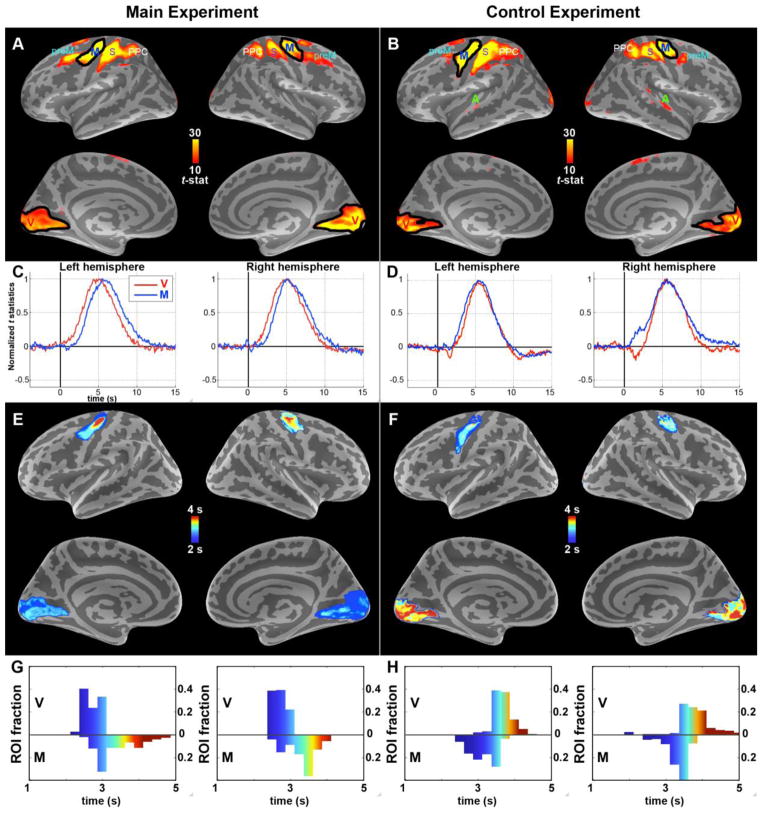
Figure 2. fMRI activations collapsed at 3 – 8 seconds and ROI selections; ROI-specific BOLD time courses; within-ROI BOLD TTH distributions.
(A) During the main (visuomotor) experiment, both visual (V) and motor (M) cortices were activated. The black outlines indicate the ROIs thresholded from these statistical images. PPC: posterior parietal cortex; S: somatosensory cortex; preM: premotor cortex (B) During the control (motor-visual) task, V and M cortices were activated. Again, the black outlines indicate the ROIs; these were over 80% overlapping with the main experiment ROIs in panel A. PPC: posterior parietal cortex; S: somatosensory cortex; preM: premotor cortex (C – D) The corresponding ROI-specific BOLD responses (peak amplitudes normalized across ROIs, group level). The order of activations clearly follows the order of external events (stimuli and task). The signal-to-noise ratio across all ROIs was 29. (E – F) Spatial distribution of latencies (TTH) within the visual and motor ROIs. Variability within ROIs was much smaller than delays across ROIs, suggesting that voxel-to-voxel variability did not confound the results. (G – H) Histograms of latencies (TTH) within the visual and motor ROIs.

