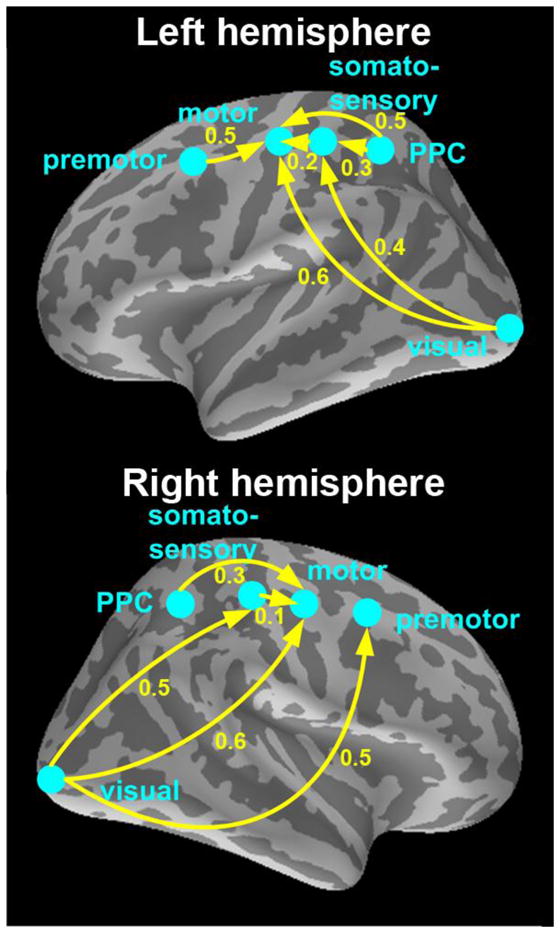
Figure 4. Latency differences between all five ROIs and direction of activation propagation.

BOLD responses were found in visual, posterior parietal (PPC), premotor, somatosensory, and motor cortices; their approximate locations are illustrated on lateral views of the inflated cortex (for actual source locations see Fig. 2A – B). Yellow arrows indicate direction of activation propagation. Solid arrows indicate p ≤ 0.05 for the latency difference between any two areas; numerical values show the differences in seconds.
