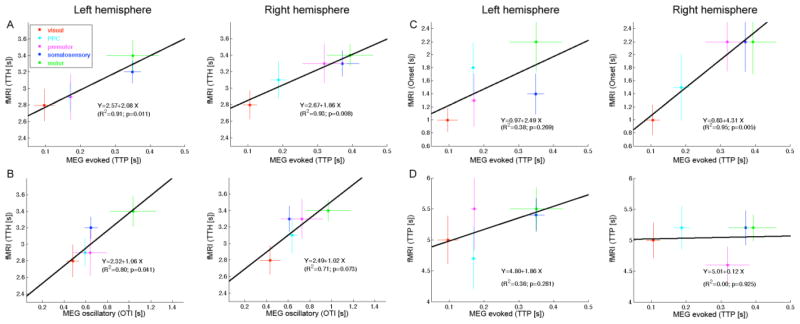
Figure 6. Correlation between electrophysiological (MEG) and hemodynamic (BOLD) timing.

A linear regression between source-specific MEG and BOLD (TTH) latencies was found separately in the left and right hemispheres using both the (A) evoked MEG response TTP values and (B) oscillatory MEG timing index OTI derived from induced responses. The slopes were about 2.3 for the evoked responses and 1.0 for the oscillatory analysis, indicating that the MEG induced responses may reflect BOLD interregional delays more faithfully than evoked responses. SEM error bars. For comparison, the gray dashed lines indicate a regression line of slope = 1.0. A linear regression was also done between MEG and BOLD Onset latency (C) and TTP latency (D). The correlations were significant in the right but not in the left hemisphere. The slopes of the regression lines were relatively steep (~2).
