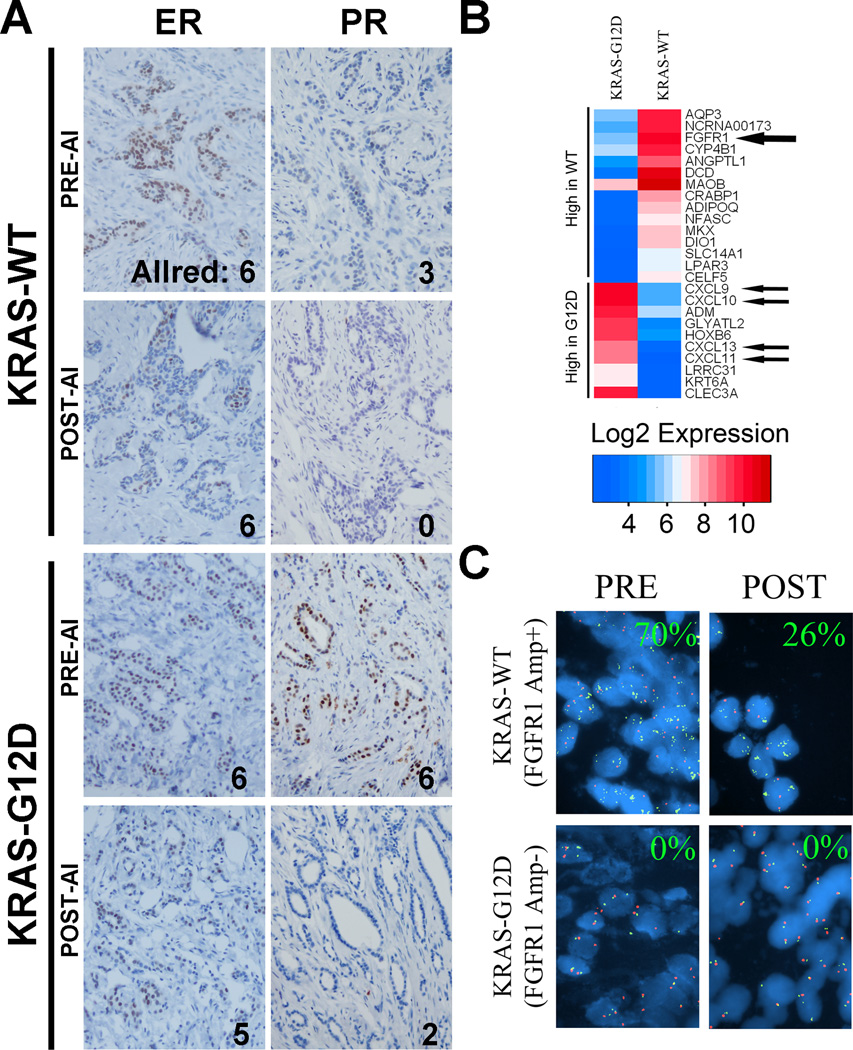
Figure 2. FGFR1 amplification in a breast tumor demonstrating molecular endocrine resistance.
A) Representative IHC and ALLRED scores for ERα (ER) and PR in the bilateral tumors, before and after 2 weeks of letrozole therapy. PR staining was substantially decrease in both tumors with letrozole therapy. B) Heatmap of the genes with the highest fold change between the left and right tumors. Among these, FGFR1 was substantially upregulated in the right tumor. C) Representative FISH for FGFR1. Percent nuclei demonstrating >5 FGFR1 gene cluster signals [green] per centromere 8 signal [red] reported in each panel.

