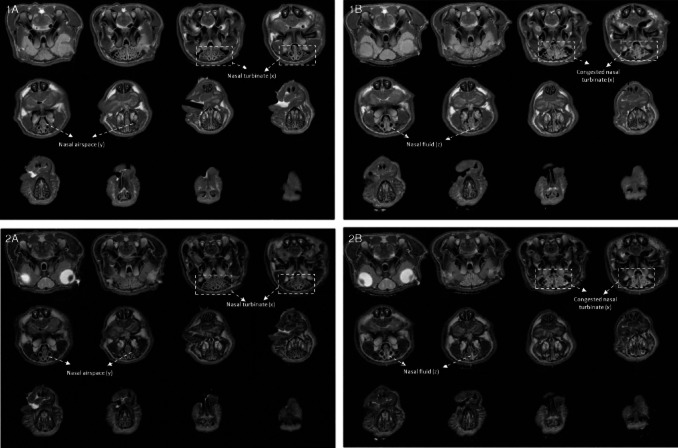
Figure 1.
Figures 1A (baseline ‘anatomical’ images) and 2A (Baseline ‘fluid’ images) illustrate typical baseline images of the nasal cavity region of the guinea pig using either a short or long TE spin echo sequence, respectively. Figure 1A and 2A produces good anatomical contrast allowing quantification of tissue (x) and airspace (y), whereas Figures 1B (10 min post unilateral capsaicin challenge) and 2B (10 min post unilateral capsaicin challenge) allow accurate quantification of fluid secretion into the nasal airspace. Following a capsaicin challenge, fluid (z) accumulation within the nasal airspace can be visualized in Figure 2B.

