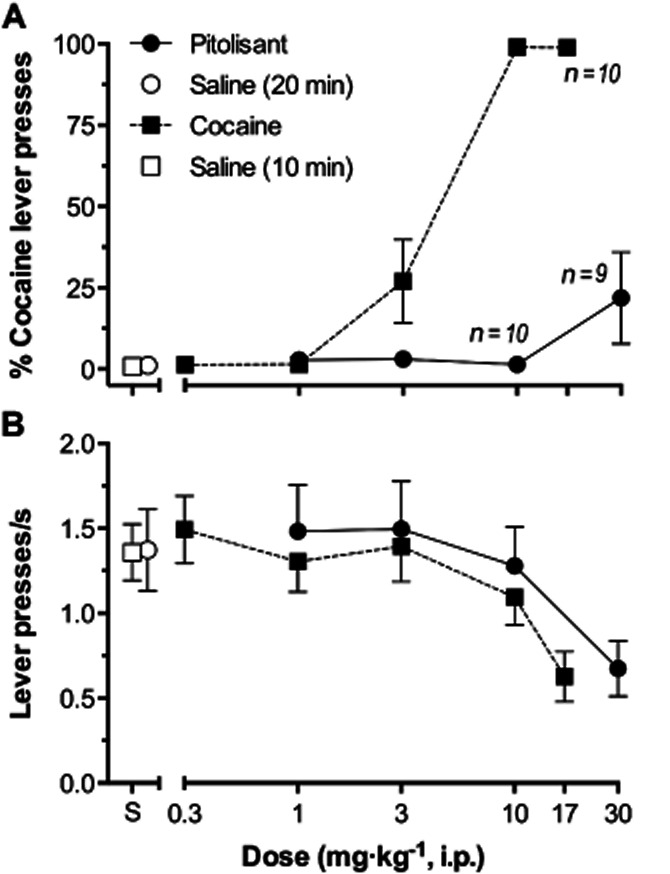
Figure 8.

(A) Mean percent cocaine lever presses as a function of Pitolisant or cocaine dose. Each symbol represents the ratio of mean number of lever presses emitted upon the cocaine-designated lever divided by the total presses upon both levers, multiplied by 100. Bars through symbols indicate SEM. Filled circles and squares indicate results with Pitolisant and cocaine respectively. Empty circles and squares indicate results of saline tests when administered 20 and 10 min pre-session, corresponding to the administration of Pitolisant and cocaine, respectively. n = 11 except at 10 and 30 mg·kg−1 of Pitolisant where n = 10 and 9, respectively, and at 17 mg·kg−1 cocaine where n = 10. The Ns were less than 11 at these doses because some mice failed to meet response rate criteria and their data were excluded (see text). ED50 mg·kg−1 (± 95% CI): cocaine, 3.8 mg·kg−1 (2.6–5.4); Pitolisant, not determinable (see text). (B) Mean number of lever presses emitted per second as a function of Pitolisant, or cocaine dose. Each symbol represents the mean number of lever presses emitted per second at either lever during the 900-s test sessions. n = 11 at all test doses. Other details as described for upper panel. ED50 mg·kg−1 (± 95% CI): cocaine, 15.85 mg·kg−1 (10.00–19.95); Pitolisant, 25.12 mg·kg−1 (12.59–50.12).
