
Figure 9.
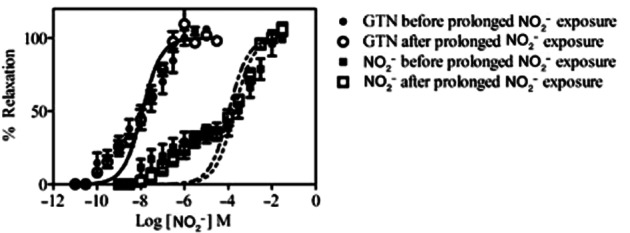
In vitro tolerance/cross-tolerance induction study. Concentration-response curves are shown for NO2− and GTN, indicating percentage relaxation of saphenous vein rings, before and after prolonged incubation with NO2−.
Official websites use .gov
A
.gov website belongs to an official
government organization in the United States.
Secure .gov websites use HTTPS
A lock (
) or https:// means you've safely
connected to the .gov website. Share sensitive
information only on official, secure websites.
In vitro tolerance/cross-tolerance induction study. Concentration-response curves are shown for NO2− and GTN, indicating percentage relaxation of saphenous vein rings, before and after prolonged incubation with NO2−.