Figure 1.

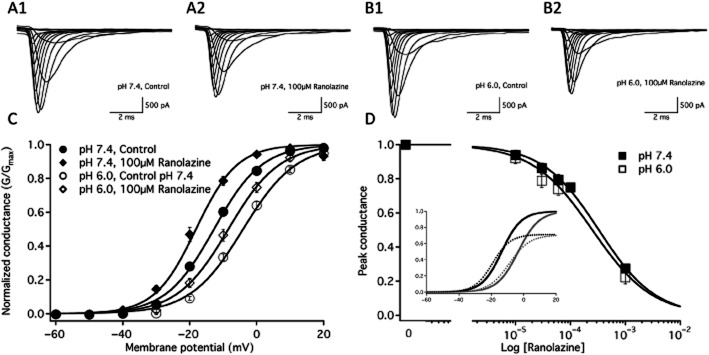
Macroscopic currents and conductance. Macroscopic current traces elicited between −90 and +70 mV before and after 100 μM ranolazine perfusion are shown at pH 7.4 in A1 and A2, respectively and at pH 6.0 in B1 and B2 respectively. C shows the conductance at pH 7.4 in control (closed circles, n = 33) and 100 μM ranolazine (closed diamonds, n = 12) as well as at pH 6.0 in control (open circles, n = 29) and 100 μM ranolazine (open diamonds, n = 14). Boltzmann curve parameters for conductance are listed in Table 1. D shows the concentration dependence of ranolazine block on the peak conductance of NaV1.2 at pH 7.4 (closed squares) and pH 6.0 (open squares). D inset shows conductance curves of the sodium channel at pH 7.4 (black) and pH 6.0 (grey) in the absence (solid lines) and presence of 100 μM ranolazine (dashed lines) as a function of membrane potential. In this case, the conductance in the presence of ranolazine is normalized to the peak conductance in the absence of ranolazine.
