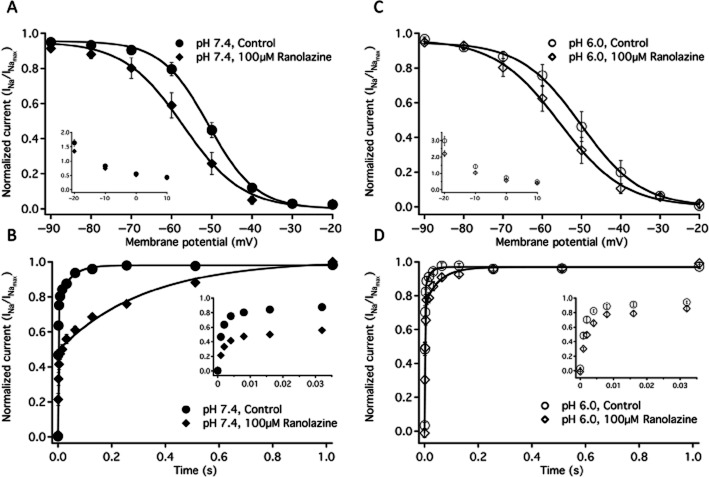
Figure 2.
Fast inactivation. (A) Steady-state fast inactivation curves at pH 7.4 in control (closed circles, n = 7) and in 100 μM ranolazine (closed diamonds, n = 7). A inset shows the time constants of fast inactivation onset at pH 7.4 in control (closed circles n = 10) and in 100 μM ranolazine (closed diamonds, n = 10) at membrane potentials from −20 to +10 mV. B shows the recovery from fast inactivation at −130 mV in pH 7.4 control (closed circles, n = 14) and in 100 μM ranolazine (closed diamonds, n = 7). B inset shows the initial 32 ms of recovery. Time constants and amplitudes are listed in Table 1. Fast inactivation steady state curves at pH 6.0 in control (open circles, n = 6) and in 100 μM ranolazine (open diamonds, n = 6) are shown in C. C inset shows the time constants of fast inactivation onset at pH 6.0 in control (open circles n = 11) and in 100 μM ranolazine (open diamonds, n = 11) at membrane potentials from −20 to +10 mV. D shows the recovery from fast inactivation at −130 mV in pH 6.0 control (open circles, n = 9) and in 100 μM ranolazine (open diamonds, n = 6). D inset shows the initial 32 ms of recovery. Boltzmann curve parameters for steady-state fast inactivation are listed in Table 1. Time constants of open-state inactivation are listed in Table 2 and time constants and amplitudes of recovery are listed in Table 3.

