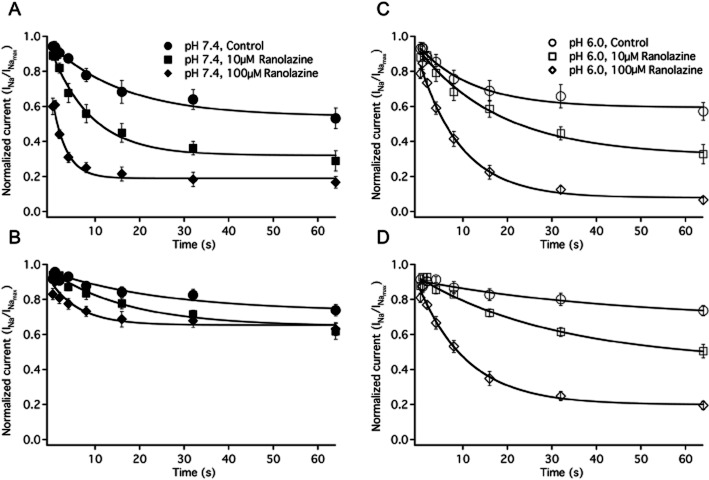
Figure 5.
Onset of slow inactivation and ranolazine block. A shows the onset of slow inactivation and ranolazine block after a 500 ms recovery pulse at pH 7.4 control (filled circles, n = 8), 10 μM ranolazine (filled squares, n = 7) and 100 μM ranolazine (filled diamonds, n = 8). Onset of slow inactivation and ranolazine block after a 2 s recovery pulse at pH 7.4 control (filled circles, n = 8), 10 μM ranolazine (filled squares, n = 5) and 100 μM ranolazine (filled diamonds, n = 8) are shown in B. C shows the onset of slow inactivation and ranolazine block after a 500 ms recovery pulse at pH 6.0 control (open circles, n = 7), 10 μM ranolazine (open squares, n = 6) and 100 μM ranolazine (open diamonds, n = 7). Onset of slow inactivation and ranolazine block after a 2 s recovery pulse at pH 6.0 control (open circles, n = 7), 10 μM ranolazine (open squares, n = 6) and 100 μM ranolazine (open diamonds, n = 7) are shown in D. Time constants, amplitudes and asymptotes are in Table 6.

