Figure 2.
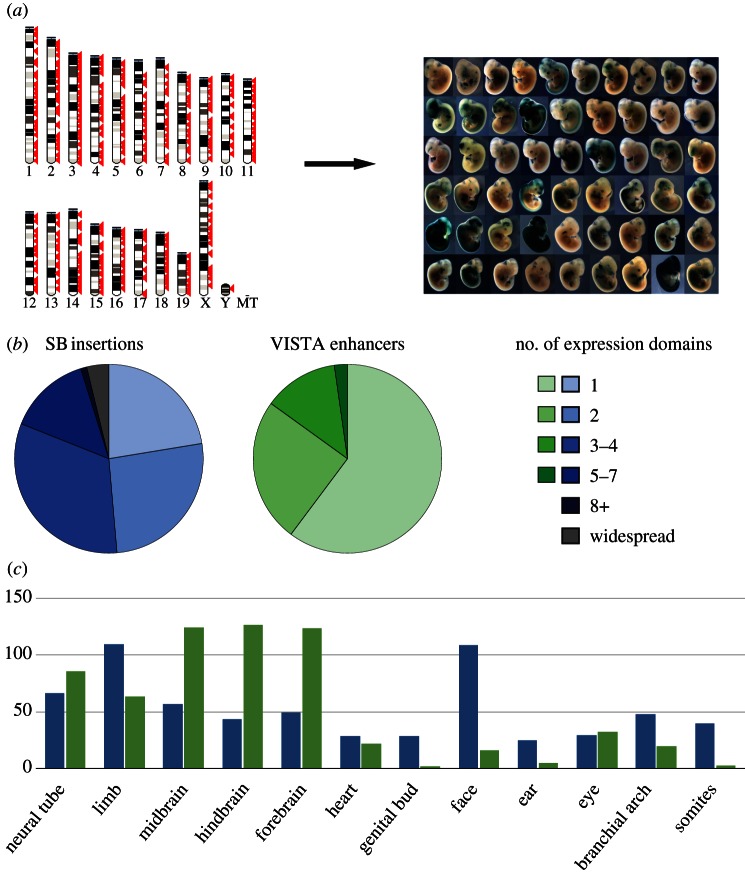
Regulatory activity captured by GROMIT and comparison with enhancer activity. (a) We generated a collection of random, genome-wide insertion sites (left, each red arrow representing an insertion site), which we tested one by one for LacZ expression at E11.5 of embryonic development, revealing pervasive, tissue-specific expression throughout the genome (right, a representative set of obtained expression patterns). A complete list of all insertions and the associated expression patterns is available in the TRACER database (tracerdatabase.embl.de). (b) Comparison of the activity of GROMIT insertions (SB insertions) and the activities documented in the VISTA enhancer browser (VISTA enhancers) [56]. The pie charts show how frequently insertions or enhancers displayed activity in a given number of expression domains (indicated by colours). For the analysis, we removed all insertions from the GROMIT dataset that were clearly part of the same regulatory landscapes (showing similar expression patterns and less than 200 kb apart), and only took into consideration VISTA enhancers from early screens (IDs between 1 and 1290), to avoid bias introduced by tissue-specific p300-bound regions [85]. (c) Distribution of tissue-specific activities between GROMIT insertions (blue bars) and VISTA enhancers (green bars). Tissues are indicated along the x-axis, and the y-axis shows the number of observed insertions/enhancers with activity in a given tissue.

