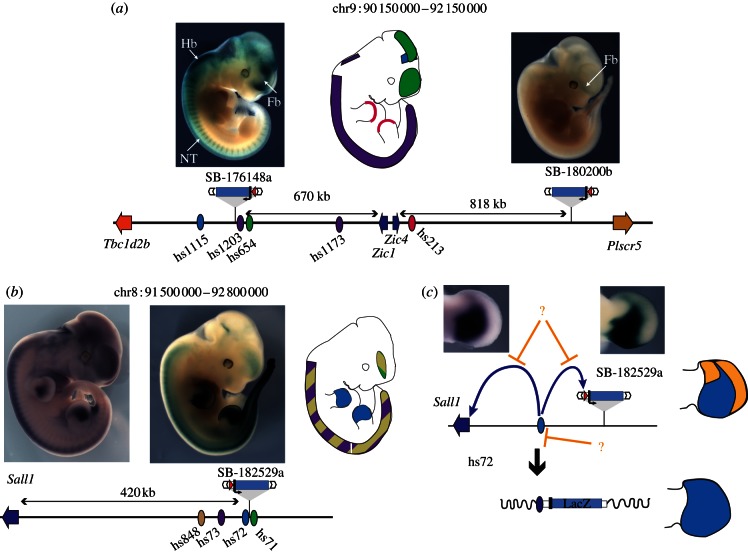
Figure 3.
Comparing the activities captured by GROMIT with individual enhancer activity and expression of endogenous genes. (a) Extent of the Zic1–Zic4 locus. The insertion SB-176148a, approximately 670 kb centromeric of Zic1 and Zic4 captures most of the expression domains predicted by the individual enhancers identified at this locus, In contrast, insertion SB-180200b, located almost 820 kb telomeric of Zic4, shows a different and weak forebrain expression. (b,c) Differences between enhancer activity and gene expression at the Sall1 locus. (b) Insertion SB-182529a, located 420 kb away from the Sall1 gene shows a similar expression pattern to the endogenous gene. These tissue-specific expressions overlap with the activities assigned to a series of enhancers within the region. (c) Interestingly, the expression patterns of Sall1 (left) and of the regulatory sensor (right) only partially capture the activities displayed by the enhancer hs72 when tested in isolation. Whereas the tested enhancer drove expression throughout the whole limb bud (bottom drawing, enhancer activity shown in blue), limb expression within the genomic context is restricted to a proximal posterior domain (top drawing, with orange shapes showing the regions where enhancer activity is restricted). Whether this suppression of enhancer activity is achieved by repression of the enhancer itself (indicated by lower, repressive orange arrow), or by disabling the interaction between the enhancer and its potential target promoters (indicated by upper, repressive orange arrows), remains unclear. For all panels, the locus is represented schematically at the bottom, with the position of genes (arrows), enhancers (ovals) and insertions indicated. Enhancers are shown as ovals, their tissue-specific activity schematically depicted on the embryo outline, using the same colour code. Pictures of the LacZ staining patterns for GROMIT insertions SB-182529a and the RNA in situ hybridization pattern for Sall1 are adapted with permission from Ruf et al. [16].

