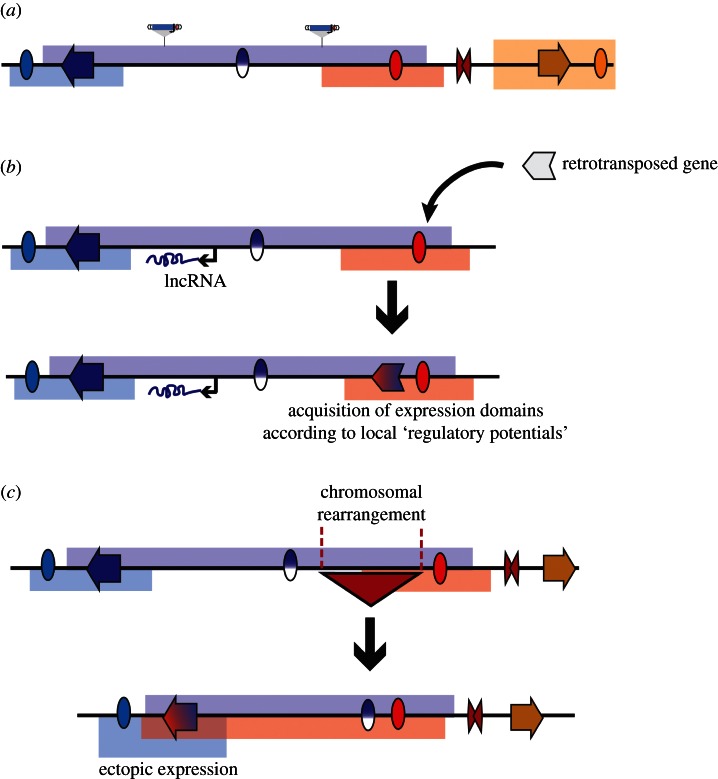
Figure 4.
An integrated view of regulatory landscapes and their implications. (a) The activity of enhancers (ovals) is distributed throughout extended regions (regulatory landscapes, indicated by bars in the same colour as the enhancer), rather than only activating specific promoters. Activities of different enhancers can overlap, giving rise to complex expression patterns. Some enhancer activities are masked within their endogenous environment, giving rise to latent activities (indicated by split blue-white oval). Distinct regulatory landscapes can be separated by insulator-like elements (red double triangle). Because regulatory activities are not targeted towards genes, this results in the widespread presence of tissue-specific expression potential, captured with GROMIT insertions (indicated by schematic of transposon). (b) The pervasive presence of regulatory activities within the regulatory landscapes can contribute to transcription of non-coding genes, such as long non-coding RNAs (lncRNAs, indicated by black arrow), giving rise to their tissue-specific expression patterns (shown by transcript in the same colour as regulatory landscape). Novel genes can easily acquire a specific expression, for example by retrotransposition into an existing regulatory landscape. Thus, a retrogene with no activity by itself (white arrow) will gain expression as part of the regulatory landscape (red–blue arrow). (c) Chromosomal rearrangements can also lead to novel expression patterns. As demonstrated by a schematic deletion of the region overlapping the red triangle, rearrangements can results in alterations of the regulatory landscape, thereby putting genes within the range of action of remote regulatory elements. Such ‘position effects’ can contribute to disease [17,88] and to the evolution of gene expression [89].

