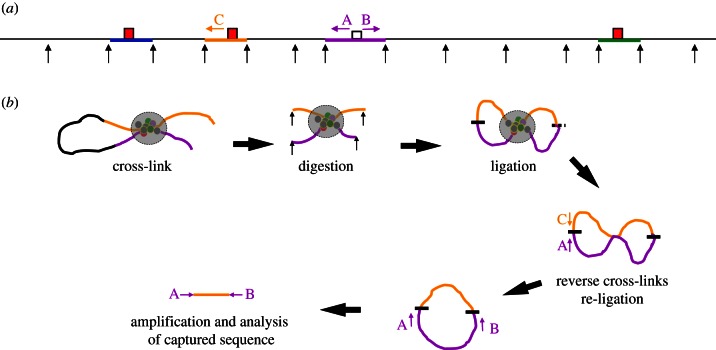
Figure 1.
Outline of 4C methodology. (a) Shows a hypothetical genomic locus in a linear configuration, black arrows represent the digestion sites for a frequently cutting restriction endonuclease. Four restriction fragments are highlighted in colour with the capture point (bait) to be analysed in purple. Three interacting cis-elements (red boxes) are shown contained within fragments coloured in blue, yellow and green. The positions of primer sequences used in 4C analysis (A and B) and in 3C analysis (A and C, for example) are shown as arrows. (b) The locus is shown with the yellow cis-element interacting with the bait by looping out the intervening sequence. The proteins associated with the two fragments (coloured circles) are shown after formaldehyde cross-linking (large grey circle) to fix the structure. The chromatin is digested after fixation (black arrows). Next, ligation produces permanent links between the two interacting fragments. The two fragments can ligate (shown as a short black line) in two ways; at both ends to produce a circle or at one end (shown as a short-dashed black line) to produce a linear molecule. These DNA/protein structures are then de-cross-linked, and the DNA isolated. Linear molecules can be converted to a circle by a second round of ligation (discussed in the main text). An interaction (for example, between the purple and yellow fragments) can be assayed using conventional 3C using primers A and C. All of the fragments interacting with the purple capture fragment (bait) can be amplified by inverse PCR using the primers A and B.

