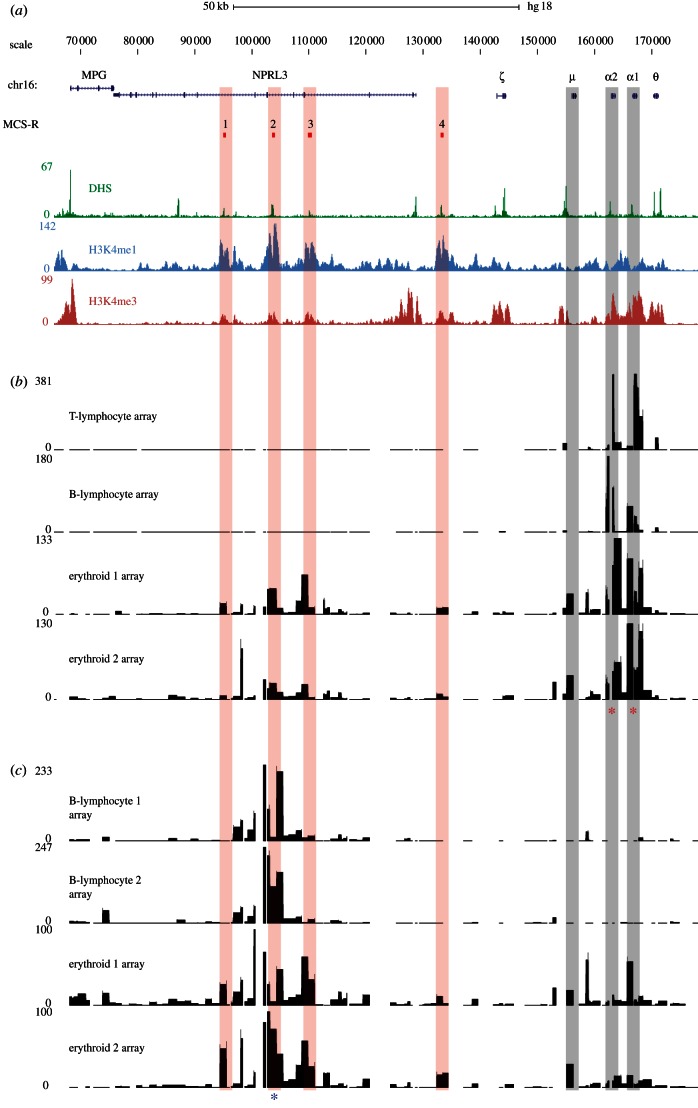
Figure 2.
Identification of cis-regulatory elements on tiled genomic microarrays using α-globin as bait. (a) A 100 kb region of human chromosome 16 from 70–170 kb of genome build HG18. RefSeq genes are shown as blue lines for gene extent, and blue ticks for exons. The MCS-R track shows the multi-species conserved sequences associated with the α-globin regulatory elements (MCS-R1–4), and their alignments to microarray features are indicated with vertical red bars. Below this are plots of DNase-seq (green) and chromatin ChIP-seq (H3K4me1 in light blue, H3K4me3 in red) data for the K562 cell line from the ENCODE project on genome build HG18. Position of HBM gene (μ) and HBA genes (α1 and α2) are indicated by vertical grey bars. (b) Inverse PCR amplification from the α-globin promoters (indicated by red asterisks) of 4C libraries derived from T lymphocytes, B lymphocytes and two biological replicates from primary erythroid cells. Samples were hybridized to tiled genomic PCR microarrays [23] using sonicated genomic DNA as an input to correct for probe hybridization efficiency. The signal on the y-axis is normalized for the total signal on the array. Genomic distance is shown, to scale with annotation, on the x-axis and fold enrichment relative to input on the y-axis. The duplicated α-globin genes have almost identical DNA sequences and, therefore, the primers simultaneously assay interactions with each promoter. (c) Inverse PCR amplification from the α-globin regulatory element MCS-R2 (HS-40; indicated by a blue asterisk) of 4C libraries derived from two B lymphocyte and two erythroid biological replicates. Samples were hybridized to the same tiled genomic PCR microarrays (above) using sonicated genomic DNA as an input. Note that the level of signal over the gene promoters is lower than that of the reverse experiment performed from the gene promoters. This highlights a technical limitation of the 4C assay. The cis-elements (MCS-R1 to R4) themselves have a relatively low GC content (54%) equal to the locus average, whereas the promoters of the HBA genes are large CpG islands with a very high GC content (73%). Although the PCR system used in this protocol is optimized for GC-rich templates, the promoters of the globin genes are difficult to amplify even using standard, non-inverse PCR. Furthermore, they are contained within relatively large DpnII fragments (899 bp). Together, these features are likely to make inverse PCR amplification relatively inefficient for these loci. This idea is supported by the stronger enrichment seen for the promoter of HBM which, while having a high GC content (72%), lies within a smaller (368 bp) DpnII fragment. Because the 4C assay relies on an inverse PCR step, large and very GC-rich fragments may be under-represented in the data produced by this assay.

