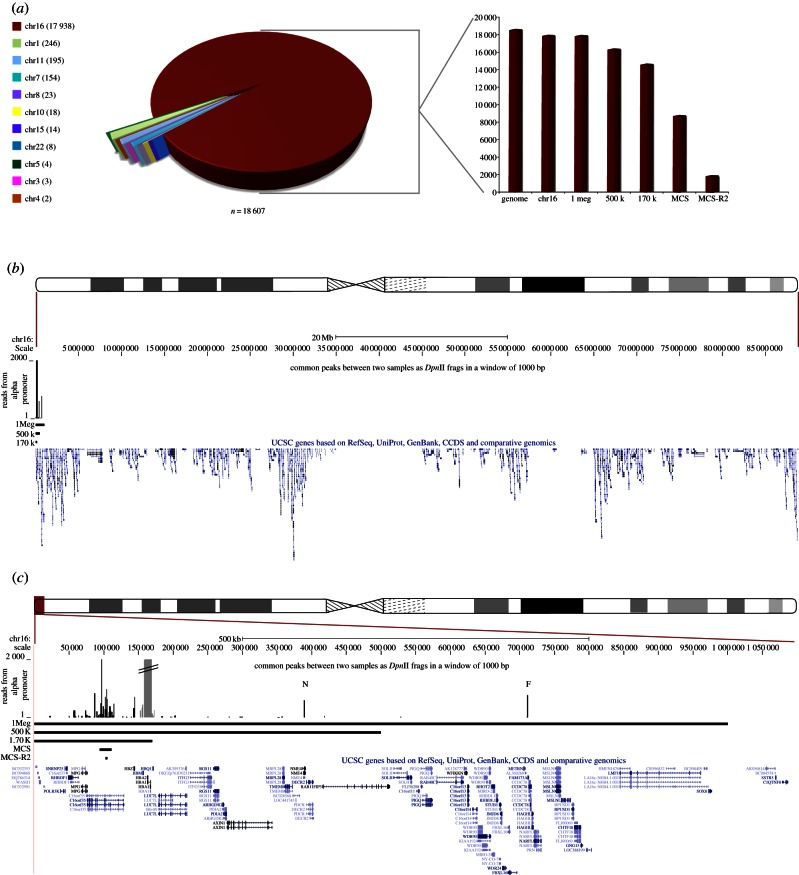
Figure 4.
Genome-wide analysis of cis- and trans-interactions with the α-globin promoter. (a) A pie chart representation of quantitative junction analysis of the two paired-end, erythroid 4C datasets, amplified from the α-globin promoter where only hits common to both datasets are represented. Each section of the pie chart represents the count (per chromosome) of all junction fragments linked to the α-globin promoter. Each interacting fragment either maps within or overlaps a 1 kb window spanning the genomic coordinates of a particular DpnII fragment in both biological replicates. Local signals around the bait (α-globin) are removed from this and all subsequent analyses (see (c) below). The numbers of junction sequences mapping to each chromosome are shown in brackets. In the adjacent bar graph, the same data are further broken down for their distribution across chromosome 16 (calculated relative to the total genome signal). The column marked ‘genome’ represents the total number of reads in this dataset; ‘chr16’ represents the sequences mapped to the whole of chromosome 16; ‘1 Mb’ represents the sequences mapped within chr16:1–1 000 000; ‘500 k’ represents the sequences mapped within chr16:1–500 000; ‘170 k’ represents the sequences mapped within chr16:1–170 000; ‘MCS' represents the sequences mapped within chr16:93 900–111 261 and ‘MCS-R2’ represents the sequences mapped within chr16: 102 493–104 848. (b) Shows the sequences mapped to chromosome 16 as a quantitative plot across its length (as displayed in UCSC). RefSeq genes and large scale regions are annotated. The region displayed is shown relative to an ideogram of chromosome 16. (c) A zoomed view to show the terminal 1 Mb region of chromosome 16p. RefSeq genes and chromosomal regions are annotated. The local signals (around the bait, α-globin) that were excluded from the genome-wide analysis are shaded as a discontinuous grey peak. The region displayed is shown relative to an ideogram of chromosome 16. The peaks of interaction corresponding to the NME4 gene and FAM173a genes are annotated by a N and F, respectively. (This is where the data are and now in §2.) To ensure that all such interactions with the α-globin promoters were observed, we relaxed the stringency of the analysis by scoring interactions with the same DpnII fragments in each dataset, but also interacting fragments in one dataset, which were within 1 kb of an interacting fragment in the other dataset.

