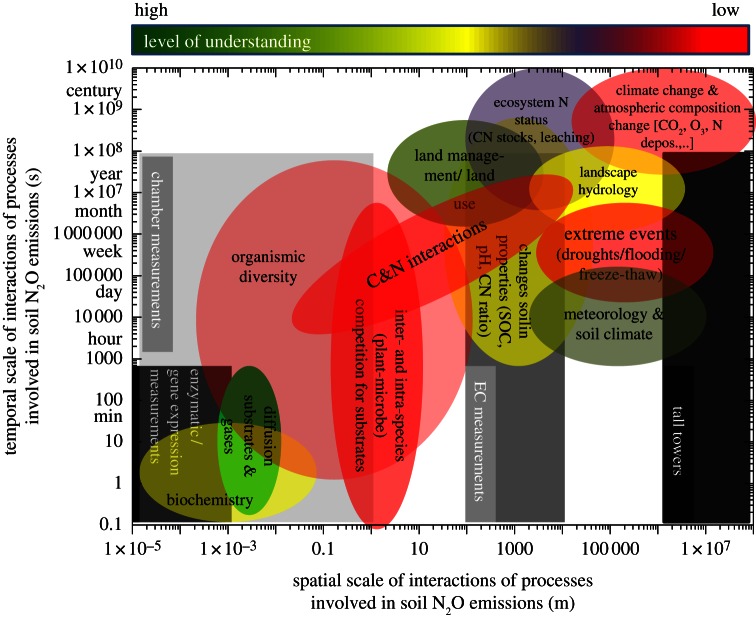
Figure 1.
Drivers and processes of soil N2O emissions across temporal and spatial scales. Different colours indicate the level of understanding. Underlying grey boxes show different measuring techniques (enzymatic, chamber, eddy covariance (EC)/micrometeorological measurements) commonly used for identifying N2O production and consumption processes and soil surface fluxes.

