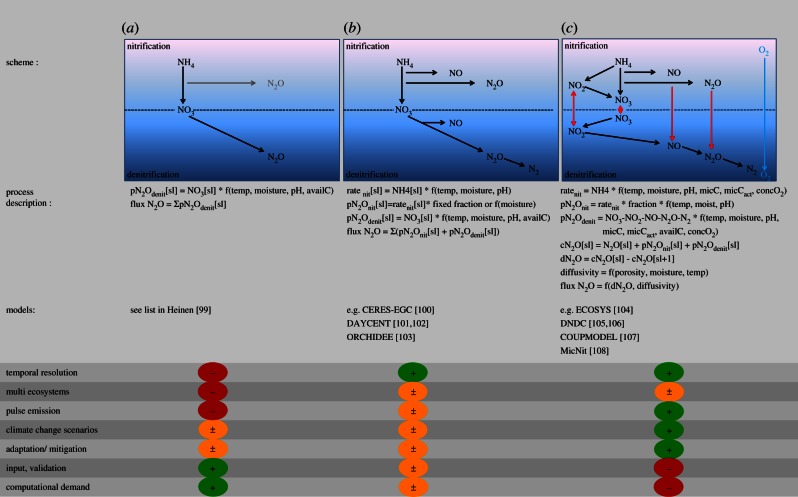
Figure 3.
Schematic of process models used for simulation of N2O emission with different degrees of complexity: (a) simplified, (b) conceptual, (c) complex. Black arrows and components are accounted for in the models, grey arrows and components are optional, red arrows indicate exchange of components between anaerobic (denitrification) and aerobic (nitrification) micro-sites in the soil. Simplified process models use potential denitrification rates which are decreased by reduction factors related to soil environmental conditions for calculation of N2O emission. In addition, conceptual models also include N2O emission from nitrification mostly by use of fixed fractions. However, both simplified and conceptual models follow the theory that N2O production in the soil equals N2O flux at the soil–atmosphere interface. Complex process models calculate N turnover via nitrification and denitrification considering the dynamics of microbes. Nitrification and denitrification N turnover is weighted by calculation of anaerobic-aerobic volume fractions as function of soil oxygen concentrations. For this complex process models take into account diffusion processes which also determine the N2O flux at the soil–atmosphere interface, thus in contrast to simplified and conceptual models emission is not equal to production.

