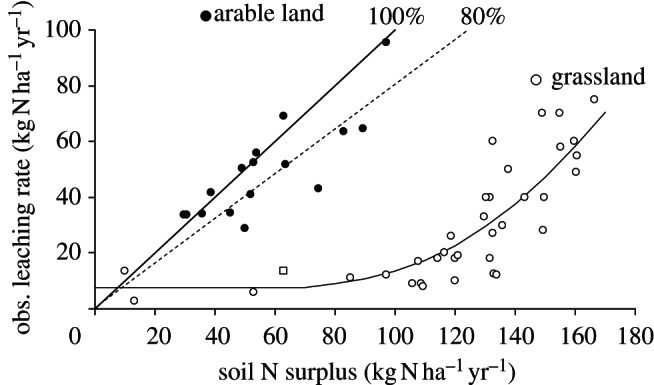
Figure 6.

Observed leaching flux (from long-term lysimetric measurements) below the root zone as a function of the agricultural N surplus calculated from long-term data on agricultural practices in the corresponding agricultural plots. (Data from different studies in the North of France [33–39] in arable land (solid symbols), and permanent grassland (open symbols). The solid and dotted straight lines represent, respectively, 100% and 80% leaching of the surplus.
