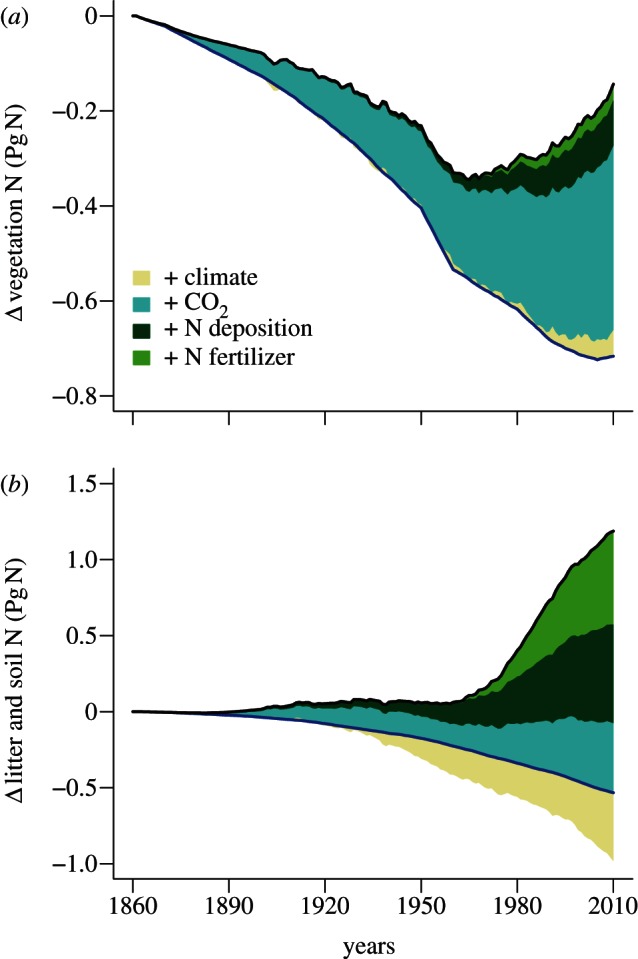
Figure 2.

Estimated development of the terrestrial nitrogen stores in (a) vegetation and (b) litter and soil organic matter. The blue line marks the changes from land-use change alone, the shaded areas indicate the changes due to individual driving forces and the black line denotes the total change of the respective nitrogen pool.
