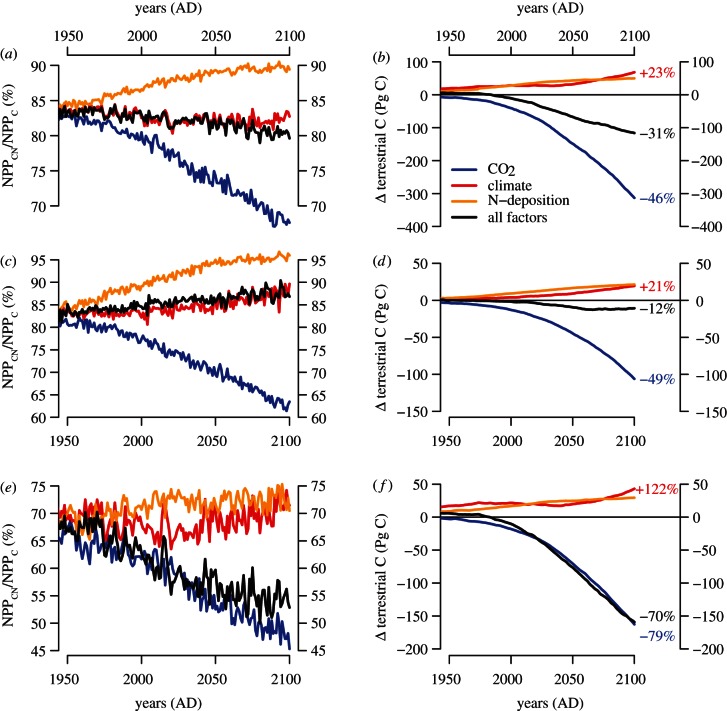
Figure 5.
Estimated reduction in (a,c,e) terrestrial net primary production and (b,d,f) terrestrial carbon sequestration due to explicitly accounting for N dynamics under the SRES A2 scenario, expressed as difference between the O–CN and O–C simulations. (a,b) The global total, (c,d) the temperate and (e,f) the boreal latitudinal bands. The percentage numbers in (b,d,f) refer to the relative difference between the model simulations with and without N dynamics. Blue lines, CO2; red lines, climate; yellow lines, N-deposition; black lines, all factors.

