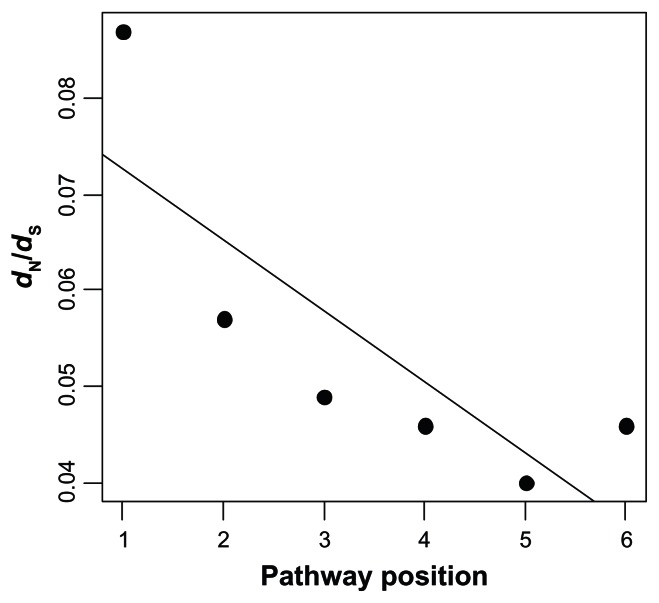
Figure 1.
Correlation between ω estimates and pathway position in the Drosophila insulin/TOR pathway. The analysis is restricted to the gene families used both by Alvarez-Ponce et al2 and by Wang et al.1 The ω estimates were obtained from Alvarez-Ponce et al.2 Positions 1–6 correspond, respectively, to genes chico, Pi3K21B, Pi3K92E, Pk61C, Akt1 and foxo.

