
Figure 1.
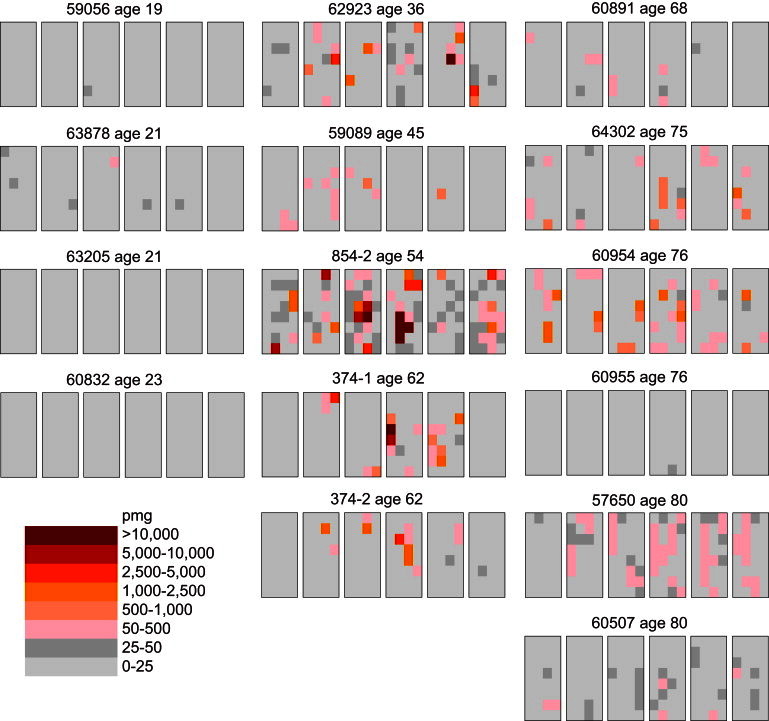
Testis Data Obtained from 15 Unaffected Donors of Various Ages
Each testis is cut into six slices (left to right), and each slice is further divided into 32 pieces (four pieces wide and eight pieces long). The frequency of the Noonan syndrome PTPN11 c.922A>G mutation is measured in each testis piece in units of mutants per million genomes (pmg). The data in the left column are from the testes of the youngest age group; all the testis pieces have low-mutation frequencies. The data in the middle column are from the testes of the middle-age group; the mutations are clustered. The data in the right column are from the testes of the oldest age group; these testes are heterogeneous as some are like those in the youngest age group while others are similar to those in the middle-age group.