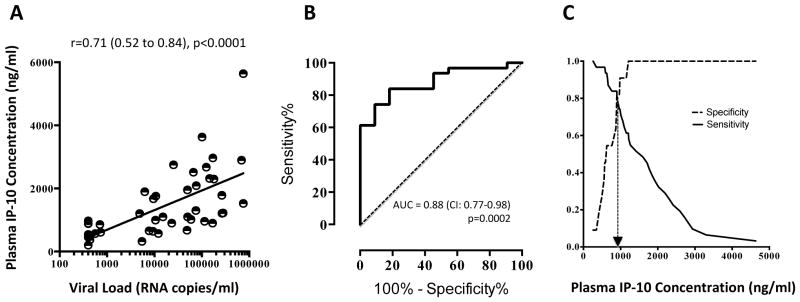
Figure 1. Plasma IP-10 concentrations correlate and predict viral load in HIV-1 infected individuals.

A. Spearman Rank correlation between IP-10 concentrations and Log10 RNA copies/ml; B. Receiver-Operating-Characteristic curve showing significant area under the curve for IP-10 above and below 5000 copies/ml; C. Specificity/sensitivity cross-over plots showing the intercept at which the concentration of IP-10 is predictive (denoted by hashed arrow line).
