
Figure 5.
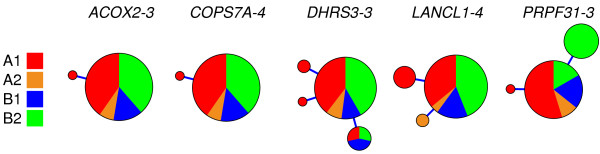
Haplotype genealogies of the five introns that show some variability in Galemys pyrenaicus. The size of the circles is proportional to the number of individuals. Colors indicate the four different mitochondrial lineages (A1, A2, B1 and B2) to which the specimens belong.