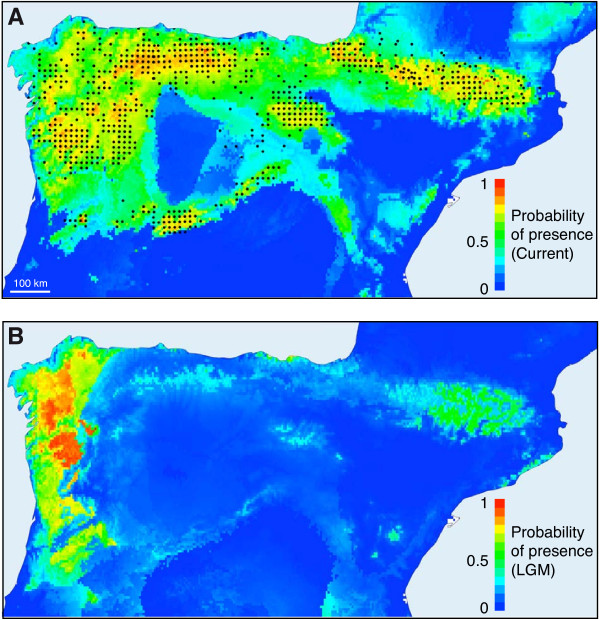
Figure 8.
Species-distribution modeling of Galemys pyrenaicus. (A) Potential distribution of G. pyrenaicus as estimated by Maxent for present time. The blacks dots represent occurrence data used for this analysis. Colors indicate probability of presence. (B) Potential distribution of G. pyrenaicus during the Last Glacial Maximum.

