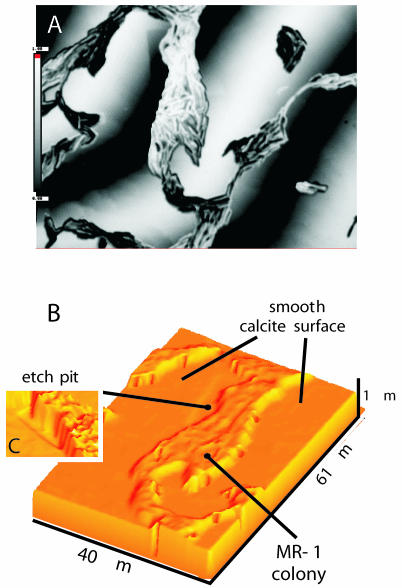
FIG. 5.
(A) Interferogram showing MR-1 colonies in height resolution. (B) Three-dimensional height map calculated from the interferogram. (C) Detail with strongly exaggerated z-scale. The image shows a shallow etch pit that is no longer deepening into the crystal surface because MR-1 has successfully blocked the high-energy site in the bottom of the pit.

