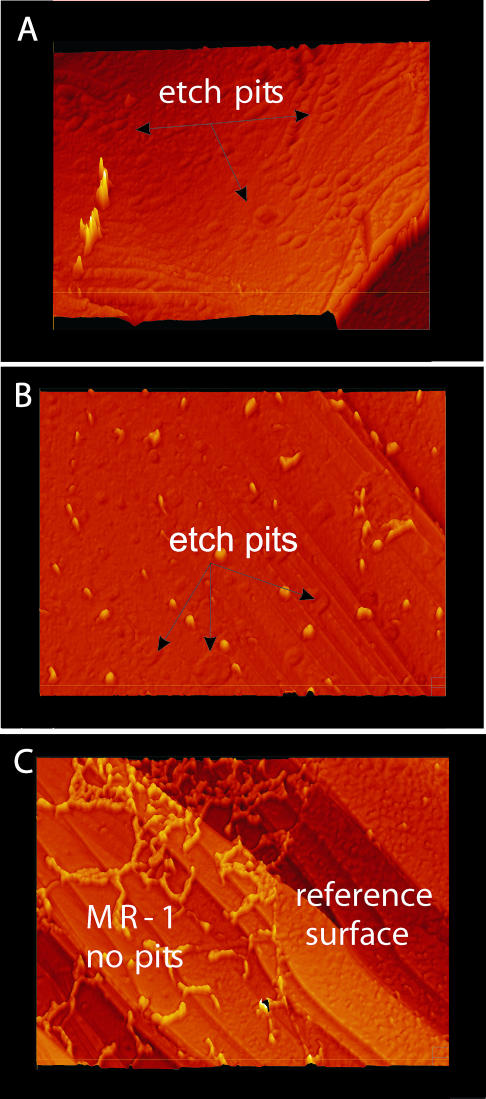
FIG. 6.
Results of live-dead experiments. (A) Etched calcite surface of the control experiment without MR-1 organisms; (B) calcite surface with dead MR-1; (C) calcite surface with live MR-1 organisms. Images were taken with a 50× Mirau objective. The total height difference was 1.60 μm for panel B and 1.65 μm for panel C; field of view, 162.4 by 122 μm.

