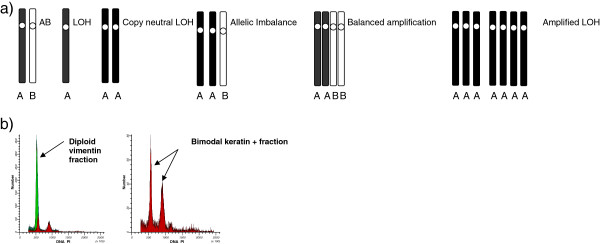
Figure 1.

a) Schematic representation of the possible allelic states according to LAIR scores b) Example of a DNA histogram of one tumor containing two populations with different DNA indexes. Green histogram is the DNA diploid vimentin positive stromal fraction and in red the keratin positive epithelial fraction.
