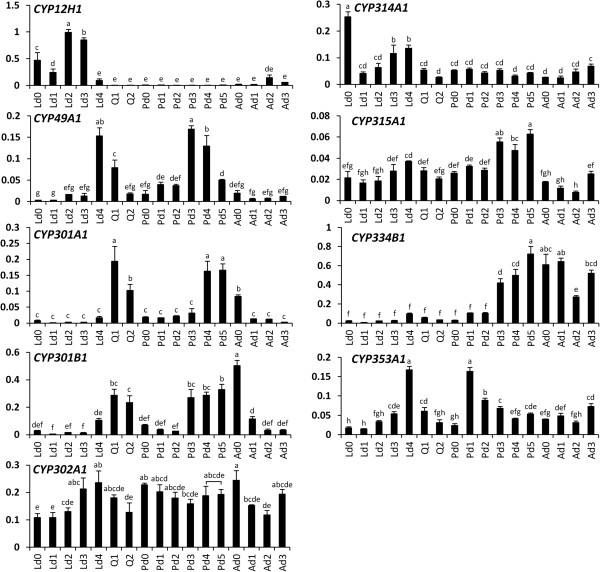
Figure 6.

Temporal expression patterns of T. castaneum mitochondrial CYPs. The mRNA levels of nine T. castaneum mitochondrial CYPs in final instar larval stage (Ld0-Ld4), quiescent stage (Q1-Q2), pupal stage (Pd0-Pd5), and adult stage (Ad0-Ad3) were quantified and normalized using rp49 as an internal control. There was no significant difference in the level of expression among samples designated with the same letter based on one-way ANOVA followed by Duncan multiple mean separation (SAS v9.4).
