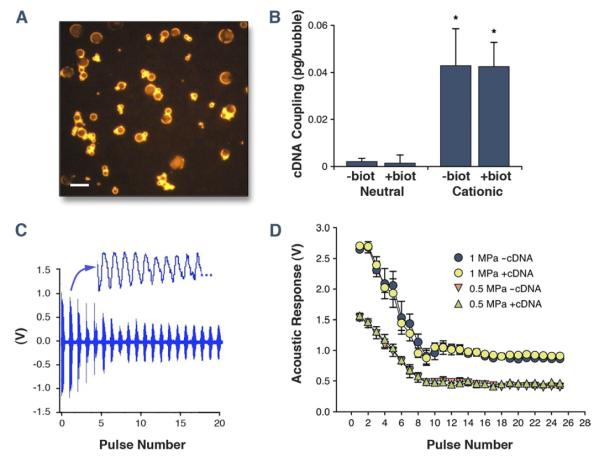
Figure 1. Properties of Lipid Microbubble Carriers.
(A) Fluorescent microscopy (excitation filter 530 to 560 nm) of SYBR-gold–labeled plasmid cDNA charge coupled to cationic microbubbles (scale bar = 5 μm). (B) Mean ± SD amount of cDNA charge coupled to the surface of different microbubble preparations. Biot = presence of DSPE-PEG-biotin. *p < 0.01 versus both neutral preparations. (C) Example of an acoustic amplitude response caused by microbubble cavitation during ultrasound exposure at 1 MPa using 30-cycle ultrasound pulses every 20 ms (50 Hz). A portion of the pressure waveform for the second pulse is expanded. (D) Mean ± SD amplitude of microbubble response (peak-to-peak) measured by a passive cavitation detector for cationic microbubbles with and without cDNA during sequential 1-MHz ultrasound pulses at 0.5- and 1.0-MPa peak negative acoustic pressure. The eventual stabilization after approximately pulse 10 was not significantly different from that obtained with saline alone (Online Fig. 1).

