
Figure 3. Averaged data of rates of decay of the twitch- and Caffeine induced Ca2+ transient indicating the SERCA2a function (A) and NCX function (B).
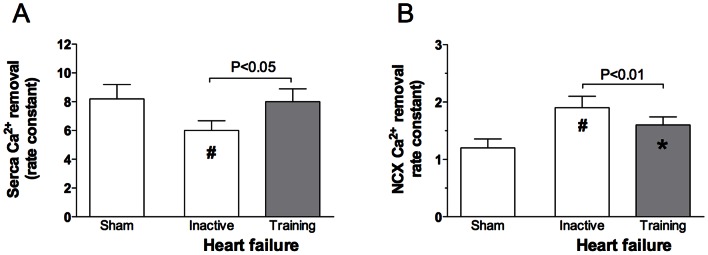
All data presented as mean values ± SD. * p<0.05 versus sham sedentary, # p<0.001 versus sham sedentary.