
Figure 5. Mitochondrial potential in bovine mammary epithelial cells.
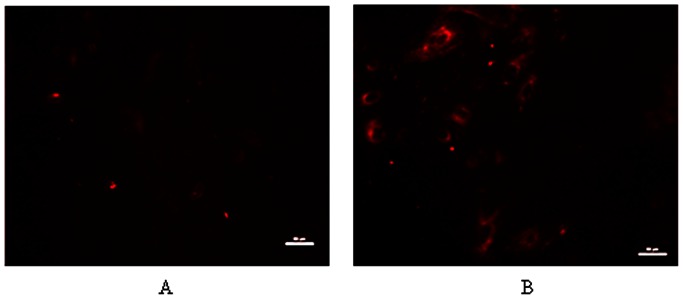
Bovine mammary epithelial cells were treated for 12 h with 2.5 mmol/L glucose (A) or 10 mmol/L glucose (B). Bars represent 50 µm.
Official websites use .gov
A
.gov website belongs to an official
government organization in the United States.
Secure .gov websites use HTTPS
A lock (
) or https:// means you've safely
connected to the .gov website. Share sensitive
information only on official, secure websites.
Bovine mammary epithelial cells were treated for 12 h with 2.5 mmol/L glucose (A) or 10 mmol/L glucose (B). Bars represent 50 µm.