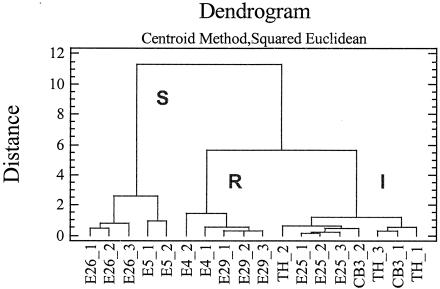
FIG. 4.
Cluster analysis performed with GTA virucidal test data by the centroid method computed by STATGRAPHICS version 4. The distance metric used was the squared Euclidean distance. Eighteen observations (virus survival ratios at the four exposure times 15, 30, 60, and 120 min) were analyzed. Two or three observations (labeled 1, 2, and 3) were available for each virus. To form the clusters, the procedure began with each observation in a separate group and then combined the two observations which were closest by the centroid method to form a new group. After the distance was computed, based on the squared Euclidean metric between the groups, the two groups that were then closest together were combined. This process was repeated until only one group remained. Viruses with the highest sensitivity to GTA inactivation, viruses with intermediate sensitivity, and those with the greatest resistance were designated clusters S, I, and R, respectively. E, echovirus; CB3, coxsackievirus B3; TH, echovirus 25 TH222.

