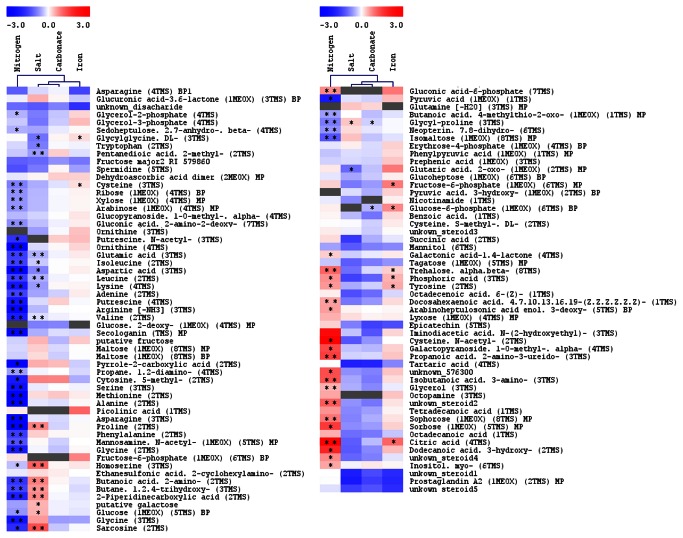
Figure 1. Heat-map of metabolic changes inThalassiosira pseudonana treated in four conditions for 24 hours.
Pearson correlation was used to cluster the results. Intensity of colours represents log2-transformed ratios of measured mean (n=5) analyte’s intensity to its respective mean value in the control conditions. Analytes, which could not be measured in more than 3 samples, were marked grey. Asterisks mark t-test P-value, where “**” marks P < 0.01 and “*” marks P < 0.05. Note, this is one heat-map, which has been presented in two blocks of data.

