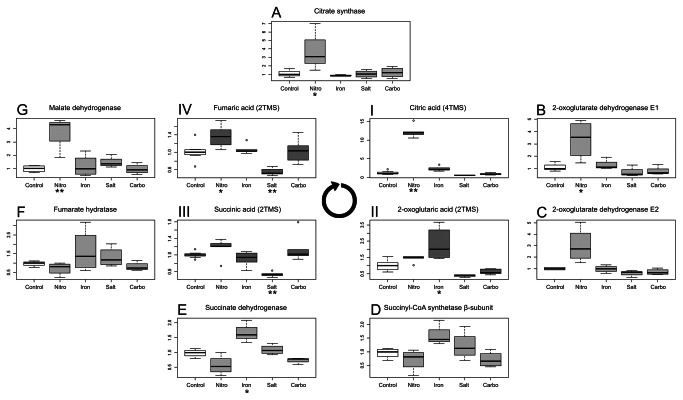
Figure 2. Changes in the TCA cycle intermediates and expression of related genes.
Three inner boxplots represent levels of (I) citric acid, (II) 2-oxoglutaric acid (III) succinic acid and (IV) fumaric acids measured in cells of T. pseudonana grown in different conditions: nitrogen limitation (Nitro), lowered iron concentration (Iron), salt addition (Salt), carbonate addition (Carbo). Values on the plots represent median values (horizontal line) of normalized peak intensity divided by median for the control samples. Outer boxplots represent relative expression of TCA-enzymes genes. Values on the plots represent median values (horizontal line) of expression divided by median for the control samples. Asterisks below a treatments name mark a statistical significant change with p-value <0.05 * or p-value < 0.01 ** in Tukey’s Test. The round arrow indicates the direction of the TCA cycle.

