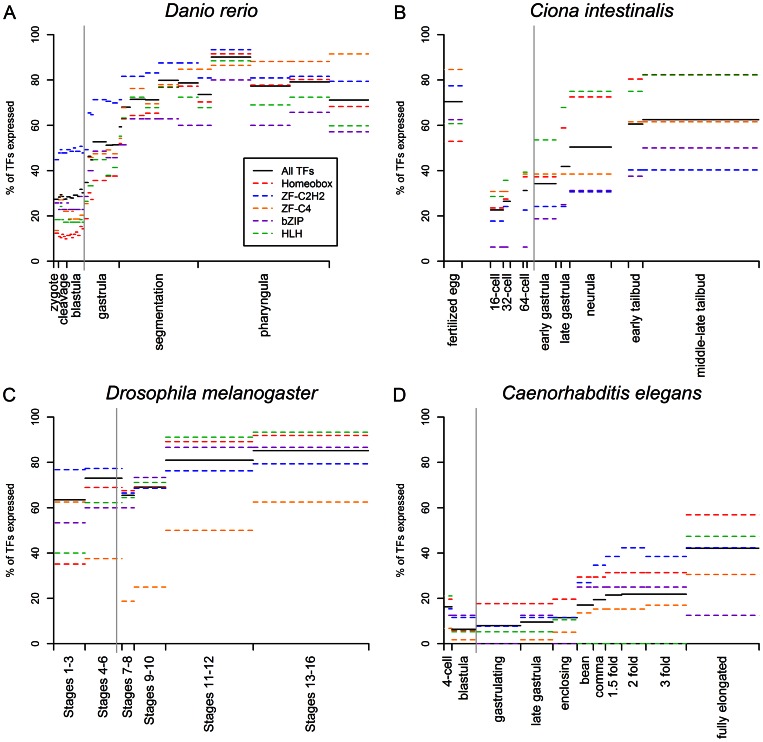
Figure 1. TF and TF family expression through embryogenesis based on in situ hybridization data.
The gray vertical line in each plot indicates the onset of gastrulation. Table S1 shows the numbers of TFs and members of TF families included in each dataset used for this figure.

