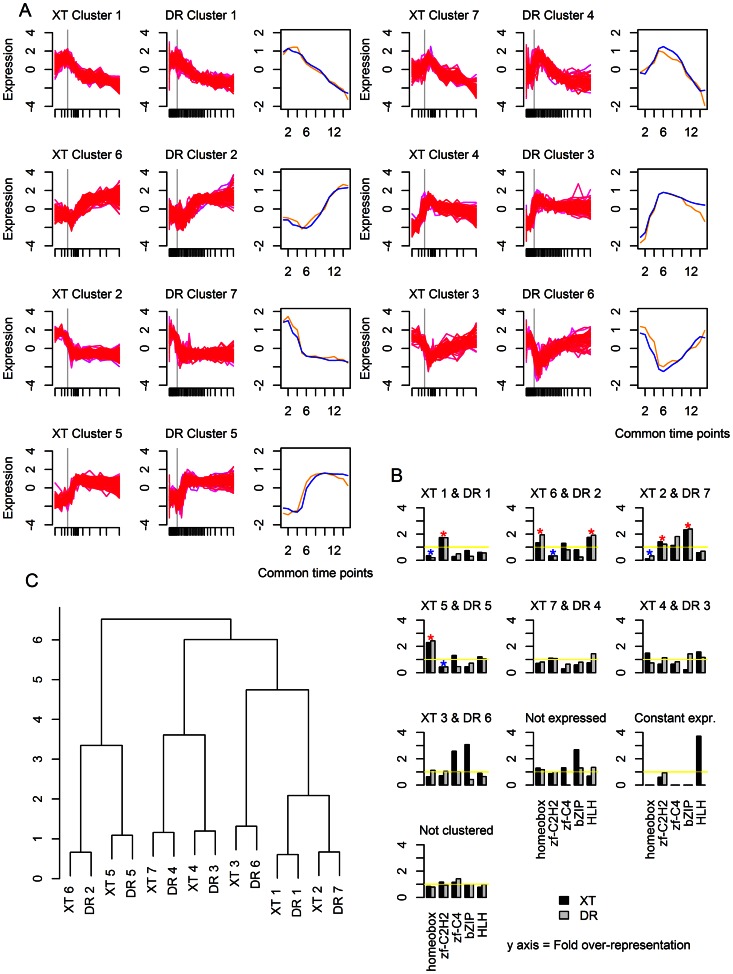
Figure 4. Comparison of TF expression clusters in Xenopus tropicalis (XT) and Danio rerio (DR).
(a) The expression profiles of the cluster pairs. The gray vertical line indicates the onset of gastrulation. The plot in the third column shows the values of the centers of the clusters at each of the common time points. Orange is Xenopus tropicalis and blue is Danio rerio. (b) Dendrogram showing hierarchical clustering of the clusters. (c) TF family representation in each cluster. The dark gray represents Xenopus tropicalis and the light gray Danio rerio. Blue stars signify statistically significant over-representation of a TF family in a cluster pair; red stars signify statistically significant under-representation of a TF family in a cluster pair.

