
Figure 4. Funnel plots for the GNB3 C825T polymorphism and its association with hypertension.
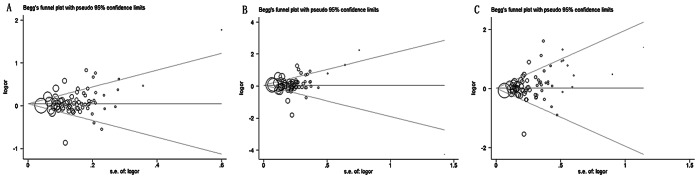
(A) the allelic model (T allele vs. C allele, p = 0.150), (B) the dominant model (TT+CT vs. CC, p = 0.565), and (C) the recessive model (TT vs. CT+CC, p = 0.043). The funnel plots should be symmetrical when no publication bias occurs; however, the funnel plot of the recessive model was asymmetrical (p = 0.043), suggesting publication bias. The other two were symmetrical (p = 0.150 and 0.565, respectively). SE, standard error; OR, odds ratio.