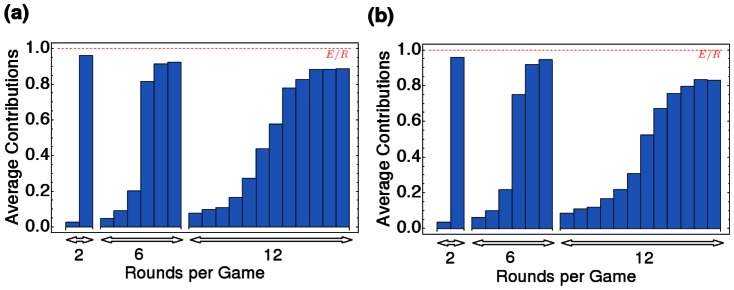
Figure 4. Timing of contributions in the collective-risk dilemma.

Simulations of the evolutionary dynamics of a collective-risk game with  , and round number
  of
of  and
and  depicting the average contribution per round. We consider two treatments: (a) Possible contributions 0 or
  . (b) Possible contributions 0,
  , or
, or  . In both treatments we observe delayed contributions, irrespective of the total game length (averages over
  generations,
  ,
,  ,
,  ,
,  ,
,  ,
,  ).
).
