
Figure 3. Regional FDG SUVR values in the lateral temporal cortex, frontal cortex, precuneus and parietal cortex of MCI converters (closed circles, n = 30) and stable patients (open circles, n = 38) at baseline.
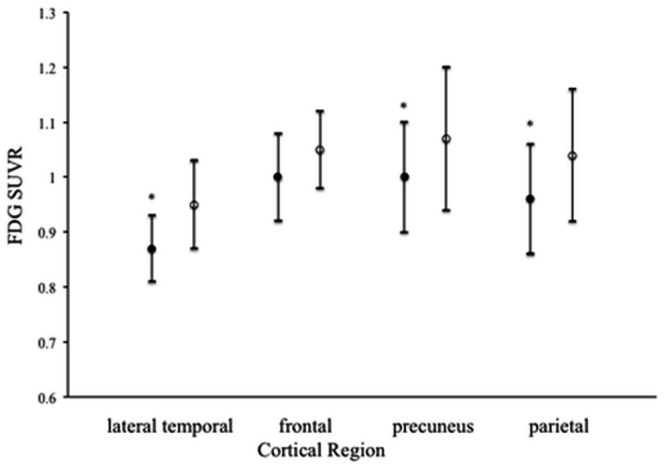
Data are presented as means ± SD. *Statistically significant difference from the stable patients by multiple comparisons post hoc tests (p<0.05).